IQR calculator | Interquartile range calculator with steps
IQR calculator
No. Separated By:
Evaluate the degree of dispersion of a data set with the help of our Interquartile range calculator. To use the IQR calculator you just have to follow these simple steps:
- Enter the data set in the input field.
- Select the separator that you have used to separate the numbers in your data set.
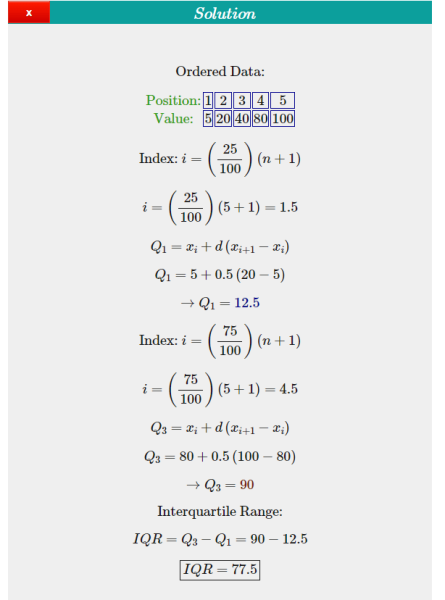
- Press the “Calculate” button to obtain the Interquartile Range of the entered data. Here is an example of how the IQR calculator offers a step-by-step solution:

What is interquartile range? | What is IQR?
The interquartile range (IQR) is a statistical measure that allows us to evaluate the level of dispersion of the data and is by its nature less sensitive to extreme values.
The formula to calculate the interquartile range is as follows:
IQR = Q3 – Q1
From the IQR formula we have that the interquartile range is defined as the difference between the Q3 and Q1 quartiles of the data.
How to find IQR
To calculate the interquartile range of a data set you just have to follow these simple steps:
- The first step is to order the data from smallest to largest.
- Next, we calculate the position of the first quartile using the following formula:
where n is the number of data. If the result of the previous calculation is an integer, the value of Q1 will be the number located in position i.
In case the result of i is a non-integer number, we assign the decimal part of i to the variable d and remove it from i, to then apply this other formula to obtain the position of Q1:
where xi is the number at position i and xi+1 is the number at position i+1.
- Then we calculate the position in which qualtile 3 is located using the following formula:
Example of interquartile range
Example 01:
Find the IQR for the set:
{3, 5, 6, 19, 20, 21, 25, 29, 34, 38, 40, 41, 56}

Example 02:
A soccer team is interested in analyzing the variability in the number of goals they receive during the season. The coach collects data from the 30 games played and obtains the following results: 0, 2, 1, 3, 2, 0, 2, 1, 0, 4, 0, 1, 3, 2, 0, 1, 1, 2 , 3, 0, 0, 1, 1, 2, 2, 3, 0, 1, 2, 1. Find the interquartile range.

All the examples presented here have been generated using the interquartile range calculator.